Processor
How to check CPU usage on a Mac (and what the numbers mean)
Updated · 6 min read
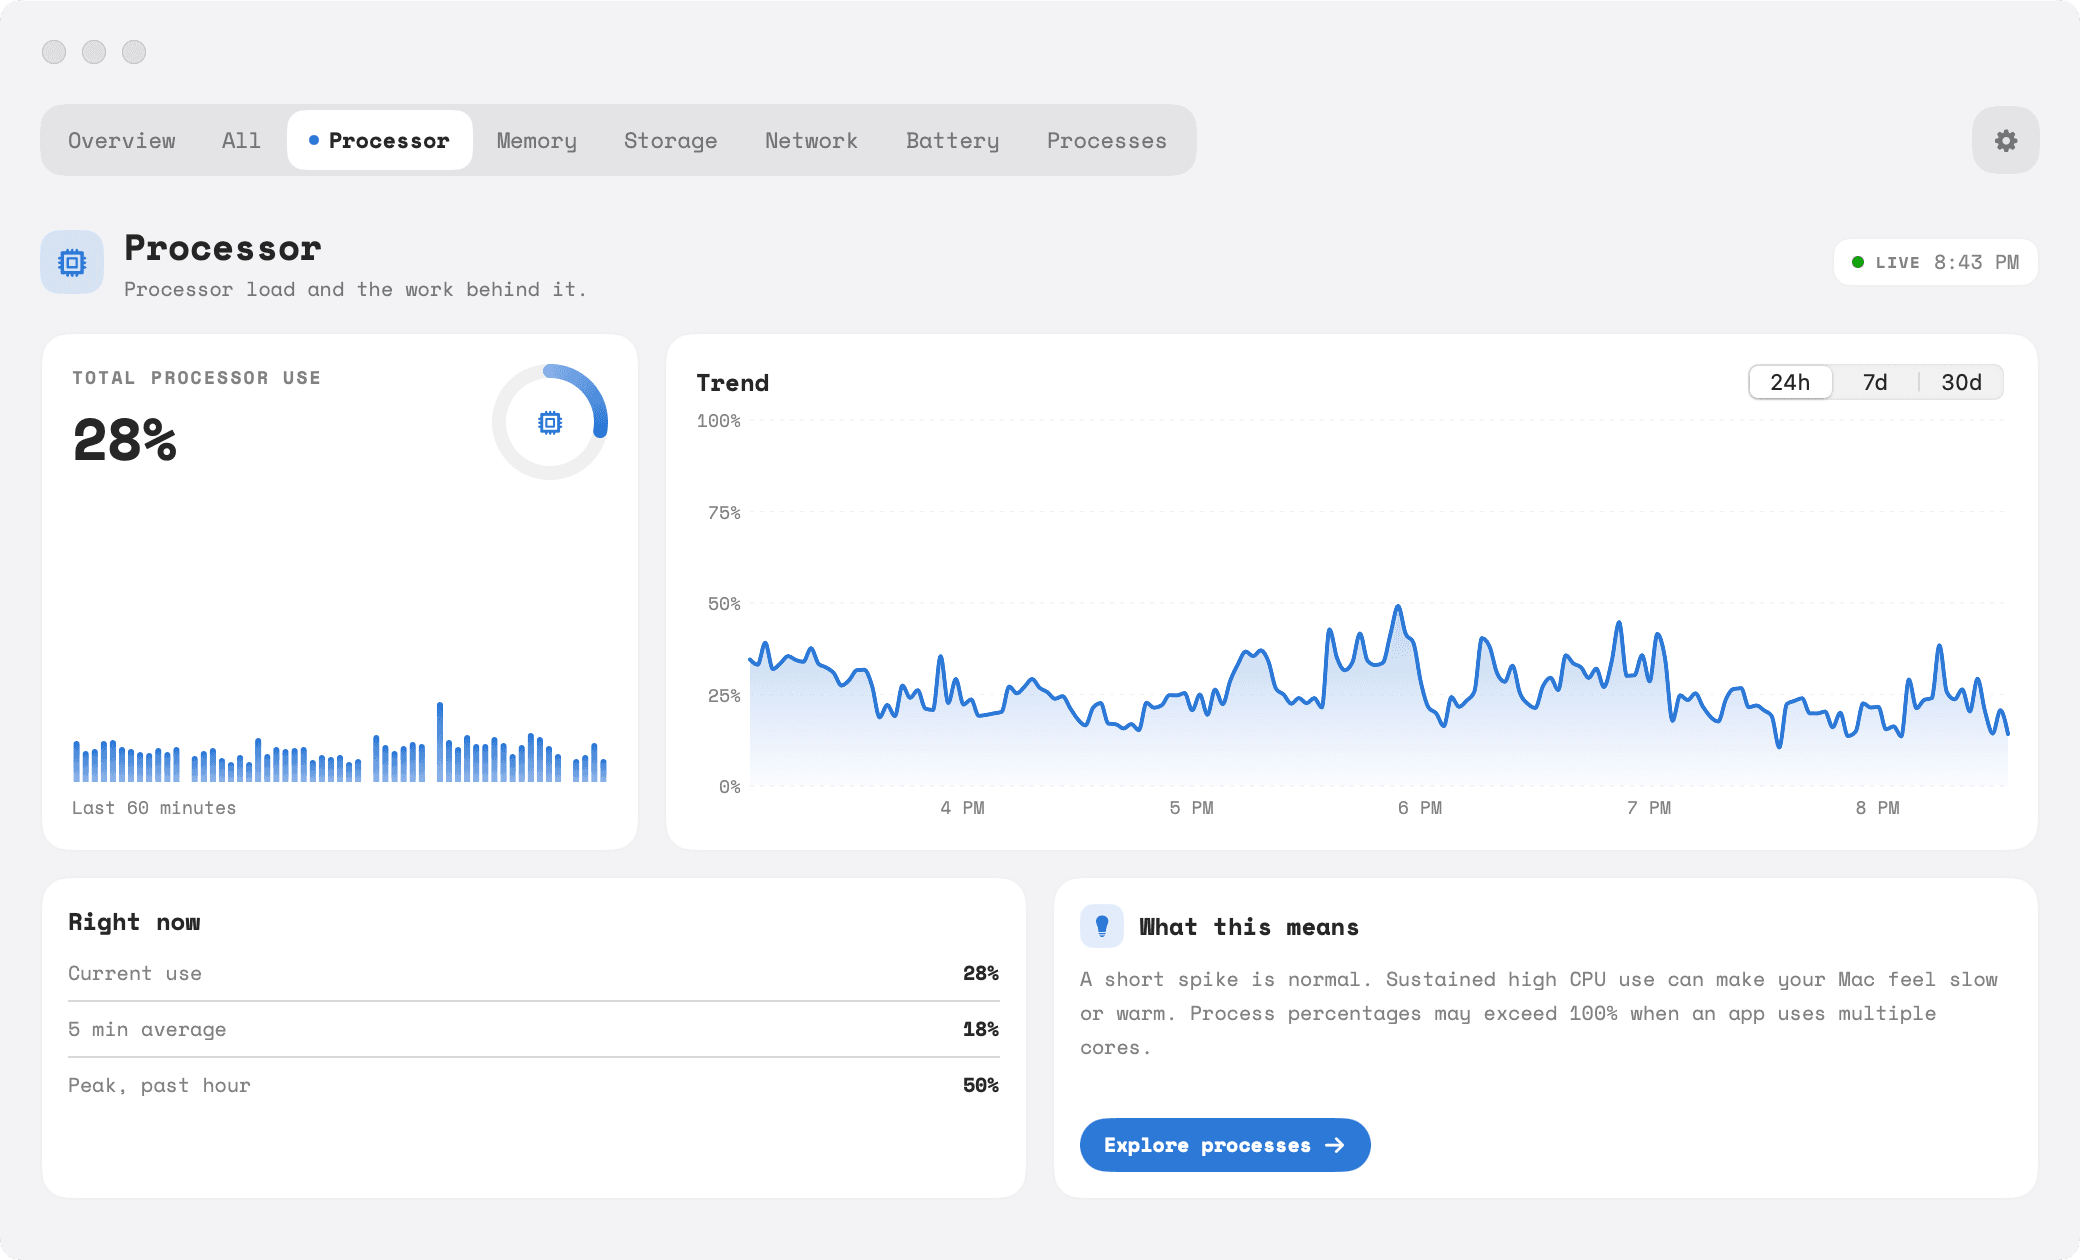
Your Mac’s processor (CPU) does the work for every app you run. When it’s busy, apps feel slow, fans spin up and the battery drains faster. Here are four ways to see how busy it is, and how to read what you find.
1. Activity Monitor’s CPU tab
Open Activity Monitor from Applications › Utilities or with Spotlight, then choose the CPU tab. Click the % CPU column header to put the busiest processes at the top.
The panel at the bottom of the window shows the whole Mac at once:
- System: work done by macOS itself.
- User: work done by the apps you run.
- Idle: how much processor capacity is free. High idle means a relaxed Mac.
Why an app can use more than 100%
Activity Monitor counts each processor core as 100%. An app using two cores fully shows 200%, and a Mac with 10 cores can reach 1,000% in total. So 150% for a video export is perfectly normal. What matters is whether an app uses a lot of CPU when it shouldn’t, for example a chat app at 90% while you’re not using it.
2. A floating CPU history window
In Activity Monitor, choose Window › CPU History for a small graph of every core over time, or Window › CPU Usage for a compact live meter. Both stay open even when you hide the main window.
3. CPU usage in the Dock
With Activity Monitor running, choose View › Dock Icon › Show CPU Usage (or Show CPU History). Its Dock icon turns into a live meter, which is handy while you track down a busy app.
4. From Terminal
In Terminal, run top -o cpu to list processes sorted by CPU use, refreshing every second. Press q to quit.
Tip
top -l 1 -o cpu -n 10, which prints the ten busiest processes once.What’s normal?
- Mostly idle: a Mac doing light work (browsing, email, writing) usually sits well above 70% idle.
- Short spikes: opening apps, loading pages and syncing cause brief bursts. That’s fine.
- Sustained high use: if CPU stays high for minutes while you aren’t doing anything heavy, find the process responsible.
kernel_task, WindowServer and friends
kernel_task: part of macOS. High use usually means your Mac is hot and macOS is limiting other work to cool down.WindowServer: draws everything on screen. It gets busier with external displays, many windows or animations.mds_storesandmdworker: Spotlight indexing, common after updates. Temporary.
Keep CPU in your menu bar
Tempo for Mac can show live CPU use right in your menu bar, keeps a 30-day processor history you can scroll back through, and can alert you when CPU stays above a level you choose. If your Mac also feels slow, work through our slow Mac checklist.