Basics
Activity Monitor explained: every tab, in plain English
Updated · 8 min read
Activity Monitor is the Mac’s built-in task manager. It shows every process running on your Mac and how much processor, memory, energy, disk and network each one uses. It looks intimidating at first, but you only need a few columns on each tab to make sense of it.
Opening Activity Monitor
Press ⌘ Space, type “Activity Monitor” and press Return, or find it in Applications › Utilities. To keep it handy, Control-click its Dock icon and choose Options › Keep in Dock.
The five tabs at a glance
| Tab | What it shows | Look at |
|---|---|---|
| CPU | How much processor time each process uses. | % CPU, and the System / User / Idle summary |
| Memory | How much memory each process uses. | Memory column and the Memory Pressure graph |
| Energy | How much battery each app is costing you. | Energy Impact and 12 hr Power |
| Disk | How much each process reads and writes. | Bytes Written and Bytes Read |
| Network | How much data each process sends and receives. | Sent Bytes and Rcvd Bytes |
CPU
Sort by % CPU to find the busiest process. Each processor core counts as 100%, so values above 100% are normal for apps using several cores. The summary at the bottom splits use into System, User and Idle. More in how to check CPU usage on a Mac.
Memory
The Memory column shows each process’s share. The most important part of this tab is the Memory Pressure graph at the bottom: green is fine, yellow means macOS is compressing memory, red means it’s swapping to disk. See what memory pressure means.
Energy
On a MacBook, this tab tells you what’s draining the battery.
- Energy Impact: a relative score of how much power an app is using right now. Higher is worse.
- 12 hr Power: the app’s average impact over the last 12 hours, or since your Mac started. Better for spotting the real culprits.
- App Nap: whether macOS has paused the app while it’s hidden, to save power.
- Preventing Sleep: apps that are keeping your Mac awake.
Disk and Network
The Disk tab shows how much each process reads from and writes to storage, which helps explain a busy or slow disk. The Network tab shows data sent and received per process, useful for finding which app is using your connection. Both have live graphs of the whole Mac at the bottom.
Quitting a stuck app
- Select the process in the list.
- Click the ⓧ button in the toolbar.
- Choose Quit to close it normally, or Force Quit if it isn’t responding.
Careful
root. Some are part of macOS and will restart or cause problems.Process names you’ll see a lot
kernel_task: the core of macOS. High CPU often means the Mac is managing heat.WindowServer: draws everything on screen.mds_stores,mdworker: Spotlight indexing.… Helper (Renderer): a browser or app tab, such as Chrome or a desktop app built with web technology.
Activity Monitor vs. a menu bar monitor
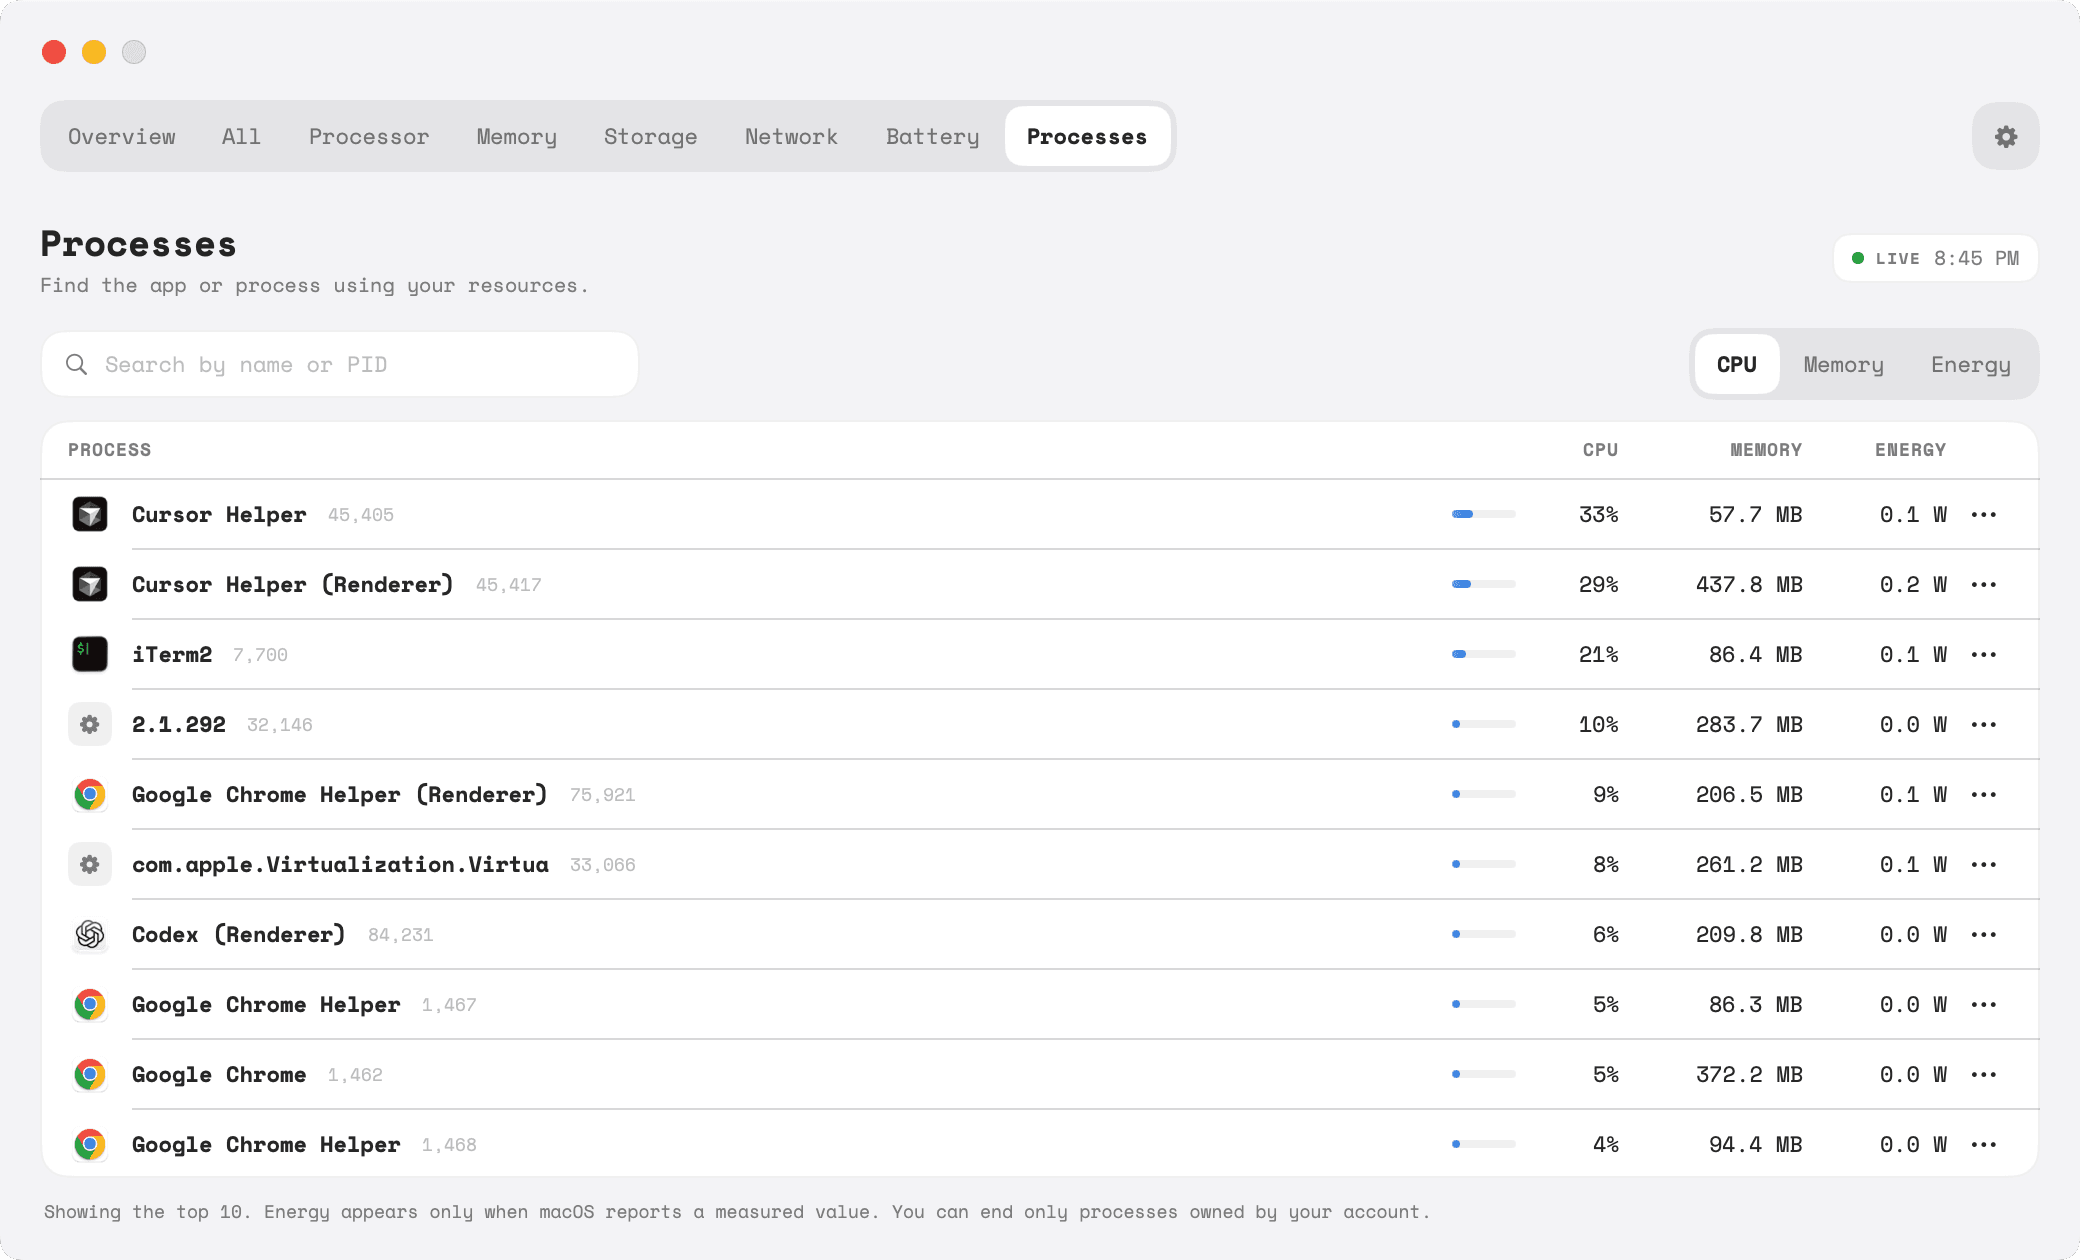
Activity Monitor is excellent, and it’s free. What it doesn’t do is stay out of the way: you have to open it, and it only shows what’s happening now. Tempo for Mac keeps the vital you care about in the menu bar, keeps 30 days of history, lists the ten busiest apps with their icons, and can alert you when something stays high.